How Much Data Is Enough? An Insertion-Loss Sensitivity Study
Three points per input are enough for the reflection-removed loss (ILcorr): the largest interpolation gap is 0.6% of baseline IL. Raw IL needs more points for substrate height and substrate εr, where the gap reaches 6.5%, and trace width needs its failed low case rerun.
Interpolation error rule
The number of points an input needs is set by its second derivative, not its slope. Near the baseline, the response of IL to an input p expands as:
A straight line captures the first two terms exactly, so the largest term it misses is the third. For straight-line interpolation between two solved points a distance h apart, the worst-case error (the max gap) falls midway between them:
Two consequences follow:
- Halving the spacing cuts the gap by four.
- A response with four times the second derivative needs only twice as many segments for the same gap.
The gap is estimated directly from three solved cases. For a single line from the low case to the high case, the gap at the baseline is:
With n equal segments across the same span the gap is G₂ / n², so the three solved points (n = 2) give G₂ / 4. This scaling assumes a smooth response between cases.
When the response is wiggly
The divide-by-four scaling only applies once the spacing is smaller than the fastest feature in the response. Before that, evenly spaced points can skip whole ripples and adding a few more barely helps.
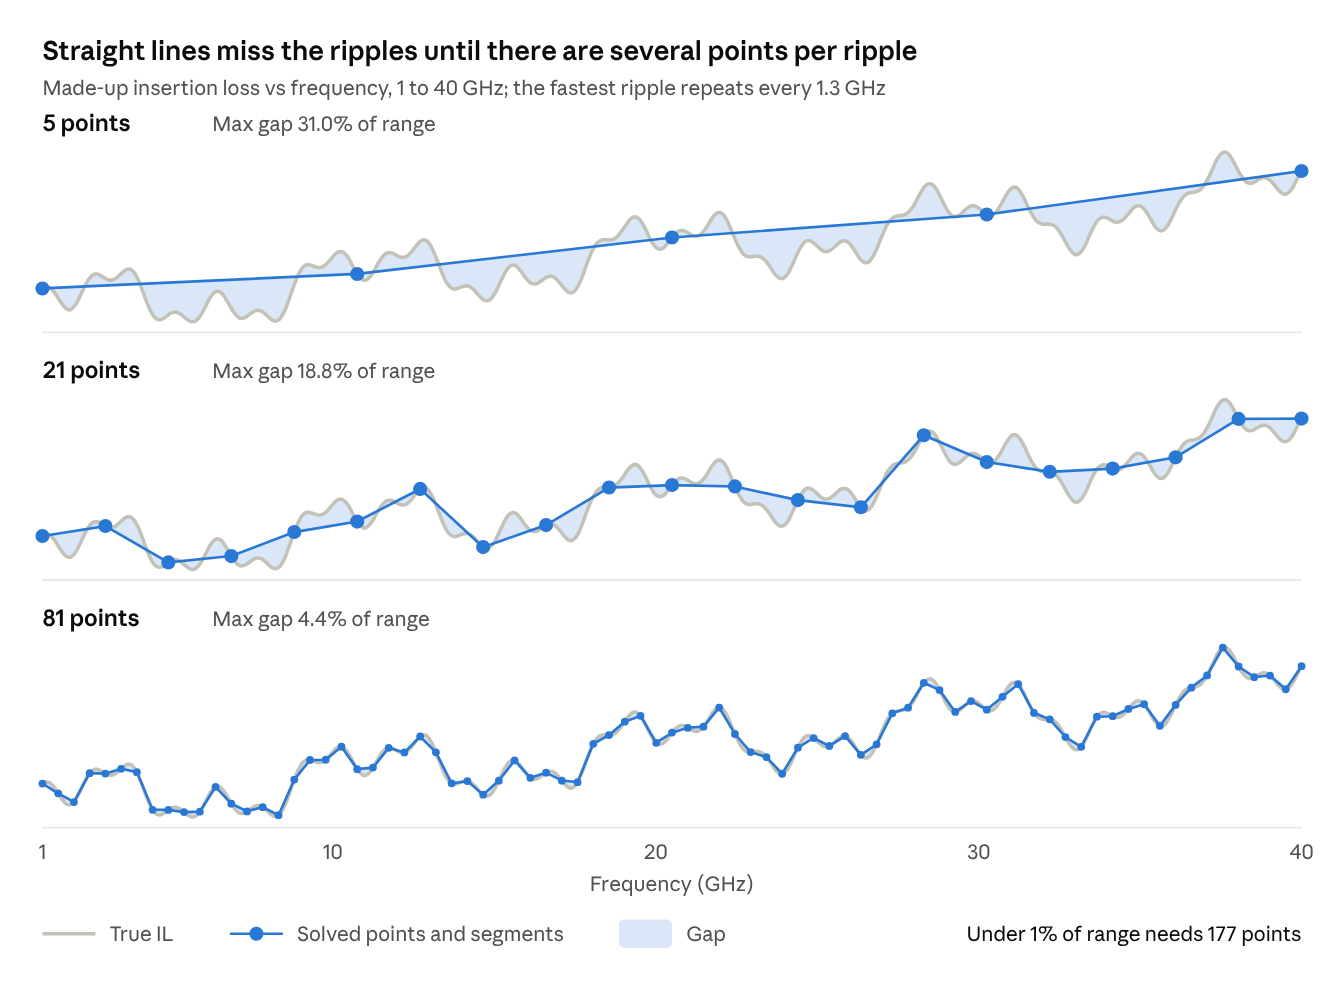
Going from 5 to 21 points cuts the spacing by five, which would shrink the gap 25 times on a smooth curve; here it falls by less than half. The smooth-curve rule takes over only at roughly three or more points per ripple, and the 1% target is reached at about six points per 1.3 GHz ripple.
Undersampling of this kind gives no warning in the data: the segments look plausible while whole features are missing. The check is to add points and see whether the result moves.
This study is the opposite case. IL against each input is smooth over ±20%, so three points go a long way, and the frequency sweep uses 0.1 GHz steps (391 points), which resolves ripples far finer than these.
Link to uncertainty quantification
An input's contribution to IL uncertainty is its normalized slope times its tolerance, so a weak input with a wide tolerance can outrank a strong one that is tightly controlled. For independent inputs with normalized slopes s and relative tolerances σ (1σ), first-order propagation gives:
Each squared term divided by the sum is that input's share of variance. Contributions do not add linearly; their squares do.
Curvature enters at second order. With c the normalized second derivative, it shifts the mean IL by:
The shift scales with tolerance squared, so the range that matters is the input's real tolerance, not the ±20% step. A tolerance of ±5% makes the curvature term 16 times smaller than it is across ±20%.
The data are sufficient when the surrogate gap and the solver noise are both small next to the propagated input spread. Manufacturing tolerances were not available for this note, so the variance budget itself is an open item.
Measured max gap
The largest three-point gap is 6.5% of baseline IL (substrate height, raw IL, 40 GHz); for ILcorr no input exceeds 0.6%. Values are G₂ / 4 as a percentage of baseline IL (±20% steps, 0.5 mm line).
| Input | Metric | 10 GHz (%) | 20 GHz (%) | 40 GHz (%) |
|---|---|---|---|---|
| Substrate height | Raw IL | 2.3 | 4.3 | 6.5 |
| Substrate height | ILcorr | 0.47 | 0.54 | 0.59 |
| Substrate εr | Raw IL | 1.0 | 1.9 | 3.1 |
| Substrate εr | ILcorr | 0.10 | 0.09 | 0.12 |
| Trace thickness | Raw IL | 0.18 | 0.20 | 0.23 |
| Trace thickness | ILcorr | 0.13 | 0.11 | 0.07 |
| Ground thickness | Raw IL | 0.04 | 0.01 | 0.02 |
| Ground thickness | ILcorr | 0.06 | 0.05 | 0.03 |
| Substrate tan δ | Both | 0.00 | 0.00 | 0.00 |
The single-line gap G₂, which is what a central-difference slope assumes, is four times each value: up to 26% for substrate height. Trace width is absent because its low case returned no result.
Points needed for a 1% target
For a gap under 1% of baseline IL, ILcorr needs at most three points per input, which the study already has. Raw IL needs about six points for substrate height and four for substrate εr at 20 GHz, rising to seven and five at 40 GHz.
Points are evenly spaced across the ±20% span, ends included. The count is n + 1, where n is the smallest whole number greater than the square root of G₂ in percent.
| Input | Metric | Range (10⁻³ dB/mm) | G₂ (% of range) | Points for <1% of range | G₂ (% of IL) | Points for <1% of IL |
|---|---|---|---|---|---|---|
| Substrate height | Raw IL | 24.97 | 52 | 9 | 17.1 | 6 |
| Substrate height | ILcorr | 13.50 | 12 | 5 | 2.2 | 3 |
| Substrate εr | Raw IL | 10.70 | 54 | 9 | 7.6 | 4 |
| Substrate εr | ILcorr | 2.00 | 14 | 5 | 0.4 | 2 |
| Trace thickness | Raw IL | 1.25 | 50 | 9 | 0.8 | 2 |
| Trace thickness | ILcorr | 1.41 | 22 | 6 | 0.4 | 2 |
| Ground thickness | Raw IL | 0.15 | 21 | 6 | 0.04 | 2 |
| Ground thickness | ILcorr | 0.33 | 43 | 8 | 0.2 | 2 |
| Substrate tan δ | Both | 1.82 | 0 | 2 | 0.0 | 2 |
All values are at 20 GHz. Range is the spread of IL across an input's low, base and high cases.
The 1%-of-range target is not achievable for trace thickness or ground thickness. Their full range is 0.2–1.9% of IL, so 1% of it lies far below the solver noise.
Findings and limits
- Raw IL is non-monotonic in substrate height and εr. IL rises on both sides of the baseline: at 10 GHz, +3% and +16% for substrate height, +7% and +1% for εr. The baseline sits near a minimum, most likely the 50 Ω match, so the reported raw slopes (for example 1.13 at 40 GHz) do not describe the response and the G₂ / 4 scaling is only approximate there.
- ILcorr is monotonic in both inputs, with three-point gaps under 0.6%.
- Tan δ is linear to the last reported digit, with a normalized slope of about 0.06 at all three frequencies. Mesh error cancels because the geometry is identical across those cases.
- Ground thickness is at the noise floor. Its changes are 0.1–0.5% of IL with inconsistent sign, which also bounds the mesh noise for geometry changes at roughly that level.
- Trace thickness is a small effect. Its ILcorr slope changes sign between 10 and 20 GHz.
- Trace width has a one-sided slope only, because the 40 µm case failed.
- ILcorr increases with substrate height (normalized slope +0.75 at 40 GHz). Conductor loss normally falls as the substrate thickens, so the sign may reflect radiation or a port effect; this is unverified.
One-at-a-time data cannot show interactions between inputs. A quadratic model with interactions for six inputs needs at least 28 runs.
Recommended next runs
- Rerun the failed trace width low case (w = 40 µm) and check the solver error log for the cause.
- Add ±10% cases for substrate height and substrate εr if raw IL is needed.
- Re-solve the baseline with a perturbed mesh to measure the noise floor directly.
- Check the sign of the ILcorr response to substrate height against a longer line or a different port setup.
- Collect manufacturing tolerances for the six inputs to complete the variance budget.